
Carbon in Reverse: A historic turning point has arrived
Forecasting carbon emissions to 2030 reveals turning point for humanity

Hello everyone,
Ever since starting my climate science career back in the late 1990s, I was always pessimistic about global carbon emissions trends. Economic growth was intimately linked to carbon growth. Outside of financial crises or pandemics, emissions always went up, never down. But momentous things are changing in the global economy.
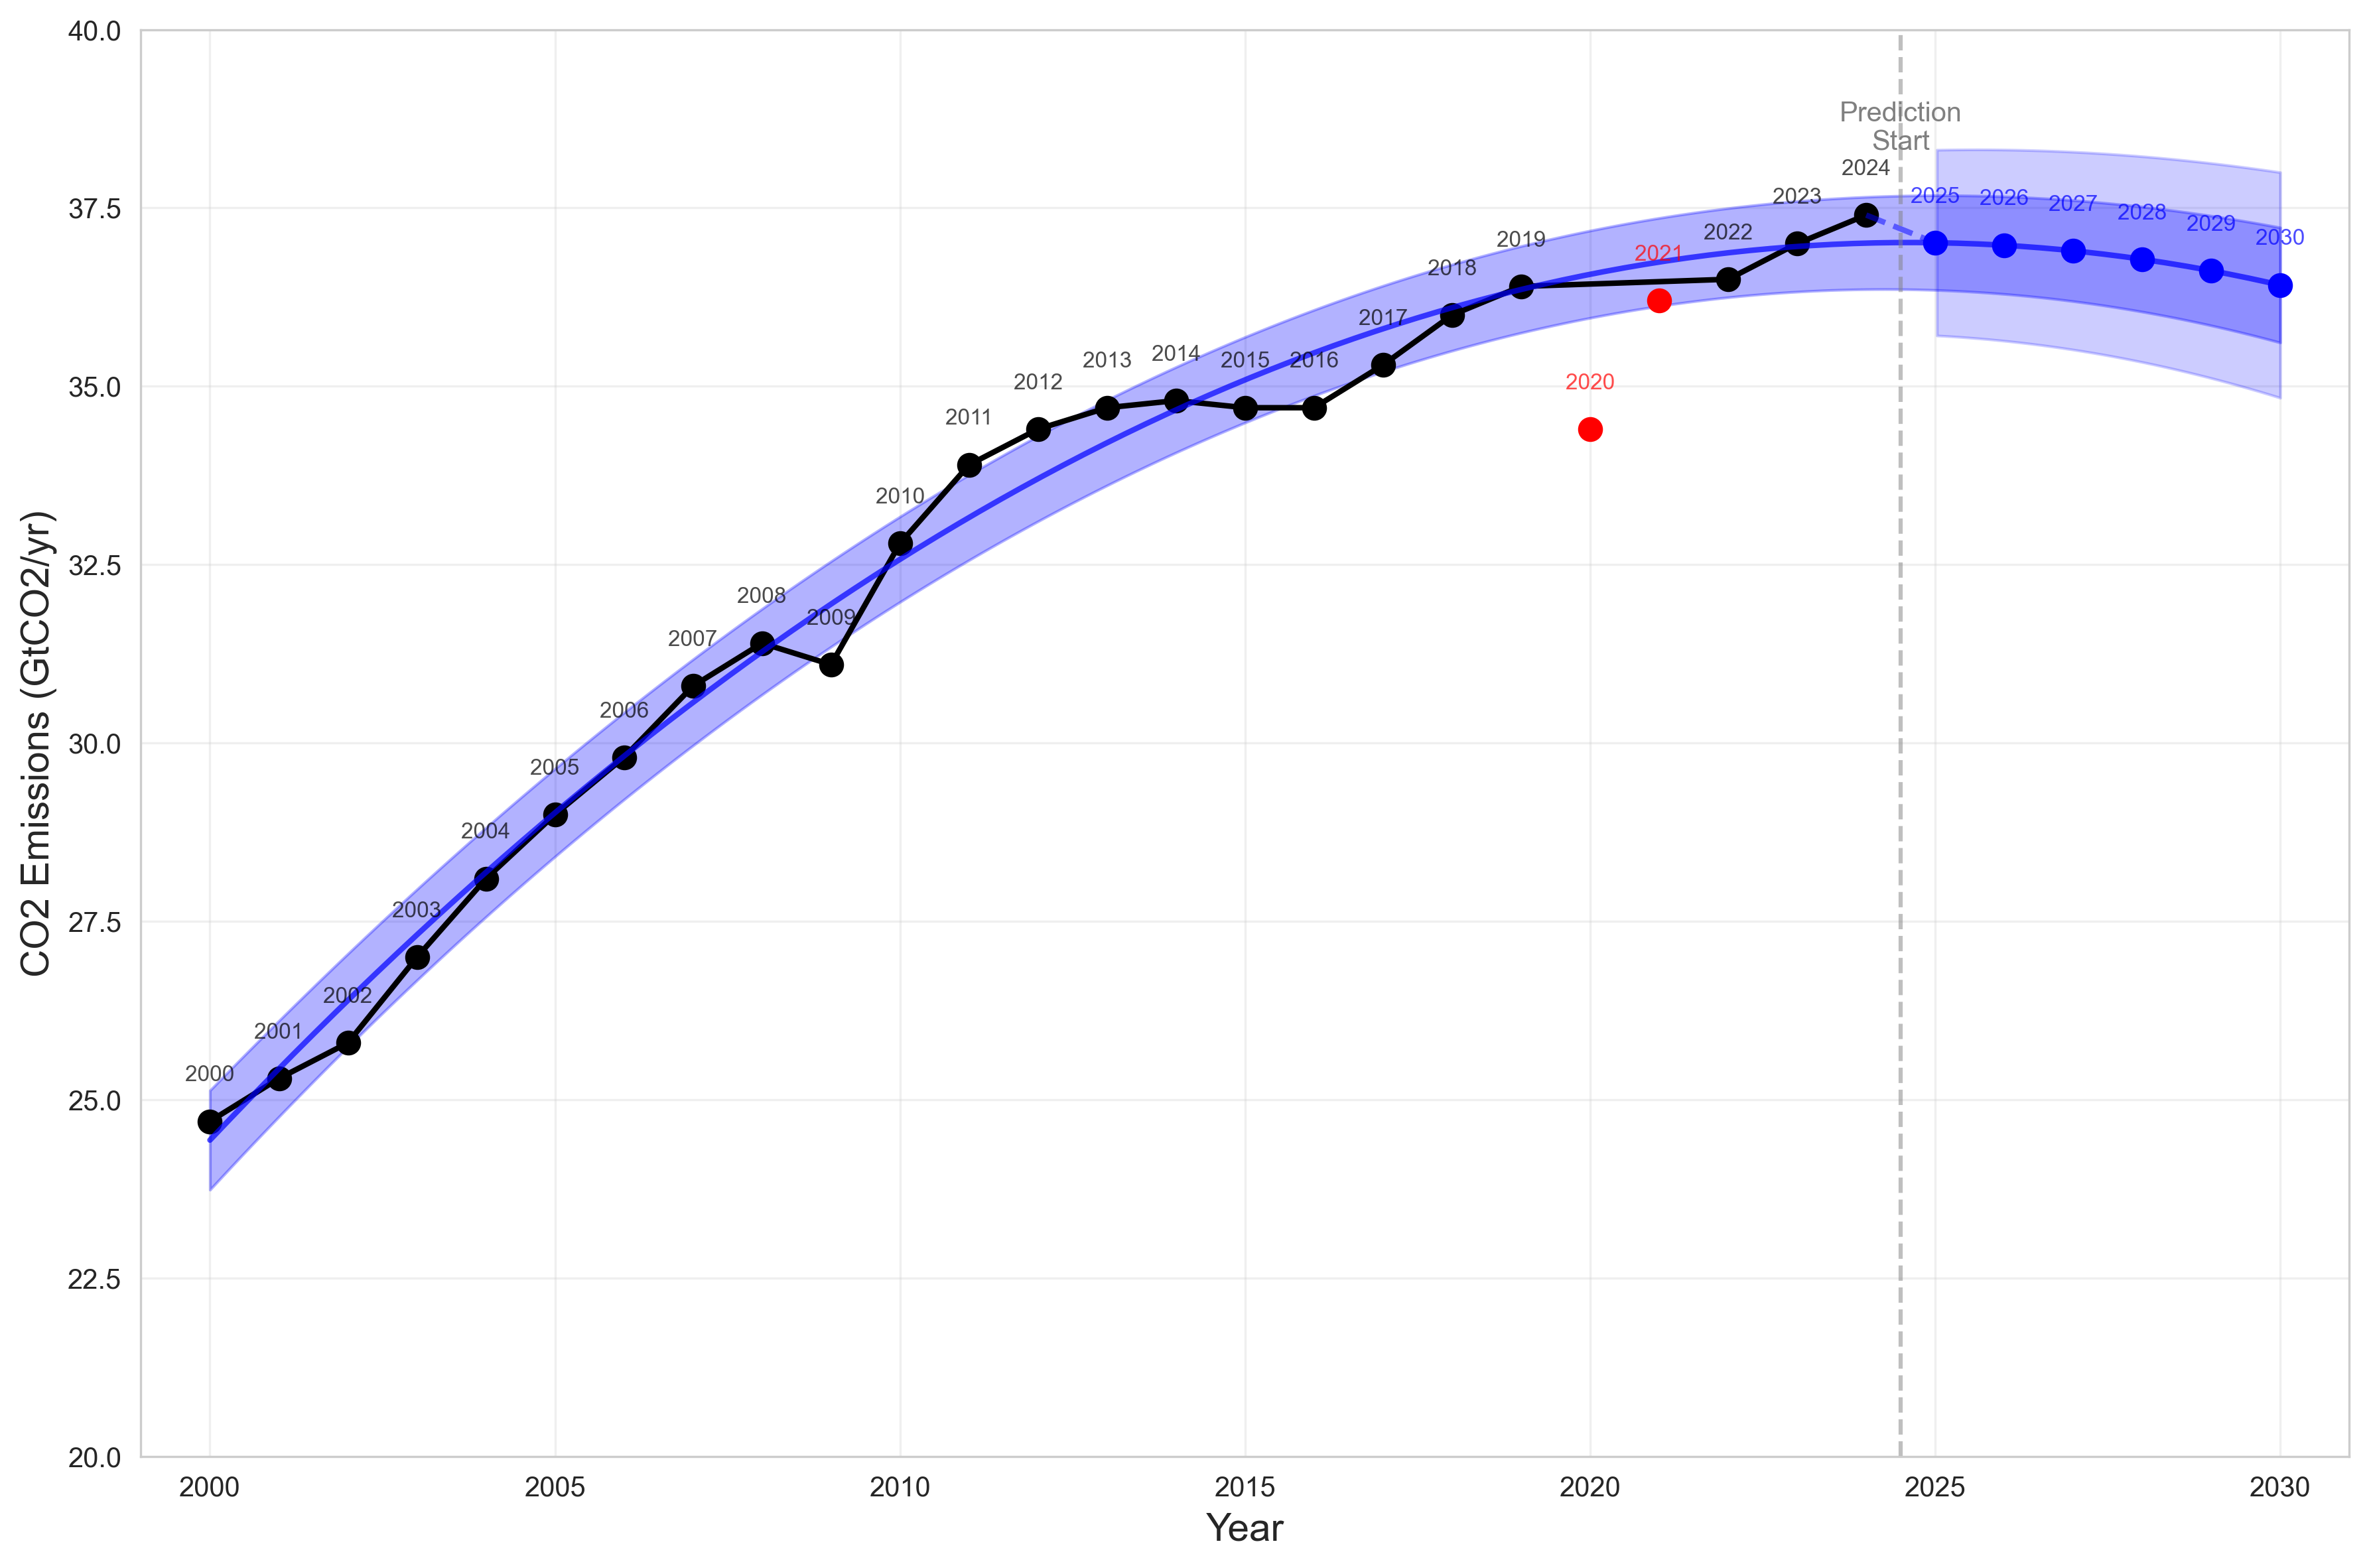
Emissions growth over the past 14 years has slowed and as I showed here, the global economy is structurally shifting to a lower carbon growth trajectory. Despite this, absolute emissions have still been growing, reaching 37.4 GtCO₂ in 20241.
But a few weeks ago, a new analysis2 suggested that China's annual emissions may have reversed for the first time, driven by massive clean energy deployment finally outpacing fossil fuel growth. This was a potential game-changer - if China, the world's largest emitter, has genuinely peaked, what does that mean for global emissions?
That made me want to investigate what future emissions are likely over the next five years. The Global Carbon Project (GCP) provides the world's most authoritative historical data, but they don't forecast emissions forward. So in this weeks newsletter, I want to fill that gap by forecasting emissions to 2030 using GCP data and I've discovered something:
We appear to be at a historic turning point: the most pivotal moment in global carbon emissions since fossil fuels first powered the Industrial Revolution.
The Post-Carbon Industrial Revolution
Using emissions since the year 2000 (excluding COVID years), I've applied a forecasting technique to project global industrial carbon emissions out to 2030 with the model capable of explaining 98.87% of the variance in CO₂ emissions data. NB: Detailed methodology is shown at the end of article
Imminent carbon reversal with forecasts suggesting the first ever multi-year structural decline in global emissions.
Global emissions are expected to plateau at 36.90 ± 0.61 GtCO₂ per year by 2027, followed by a gradual 0.12 GtCO₂ decline per year through 2030. This isn't wishful thinking - it's what the historical data shows when you weight recent trends more heavily and account for longer-term structural changes in the global economy.
Country-Level Dynamics: The Anatomy of Peak Carbon
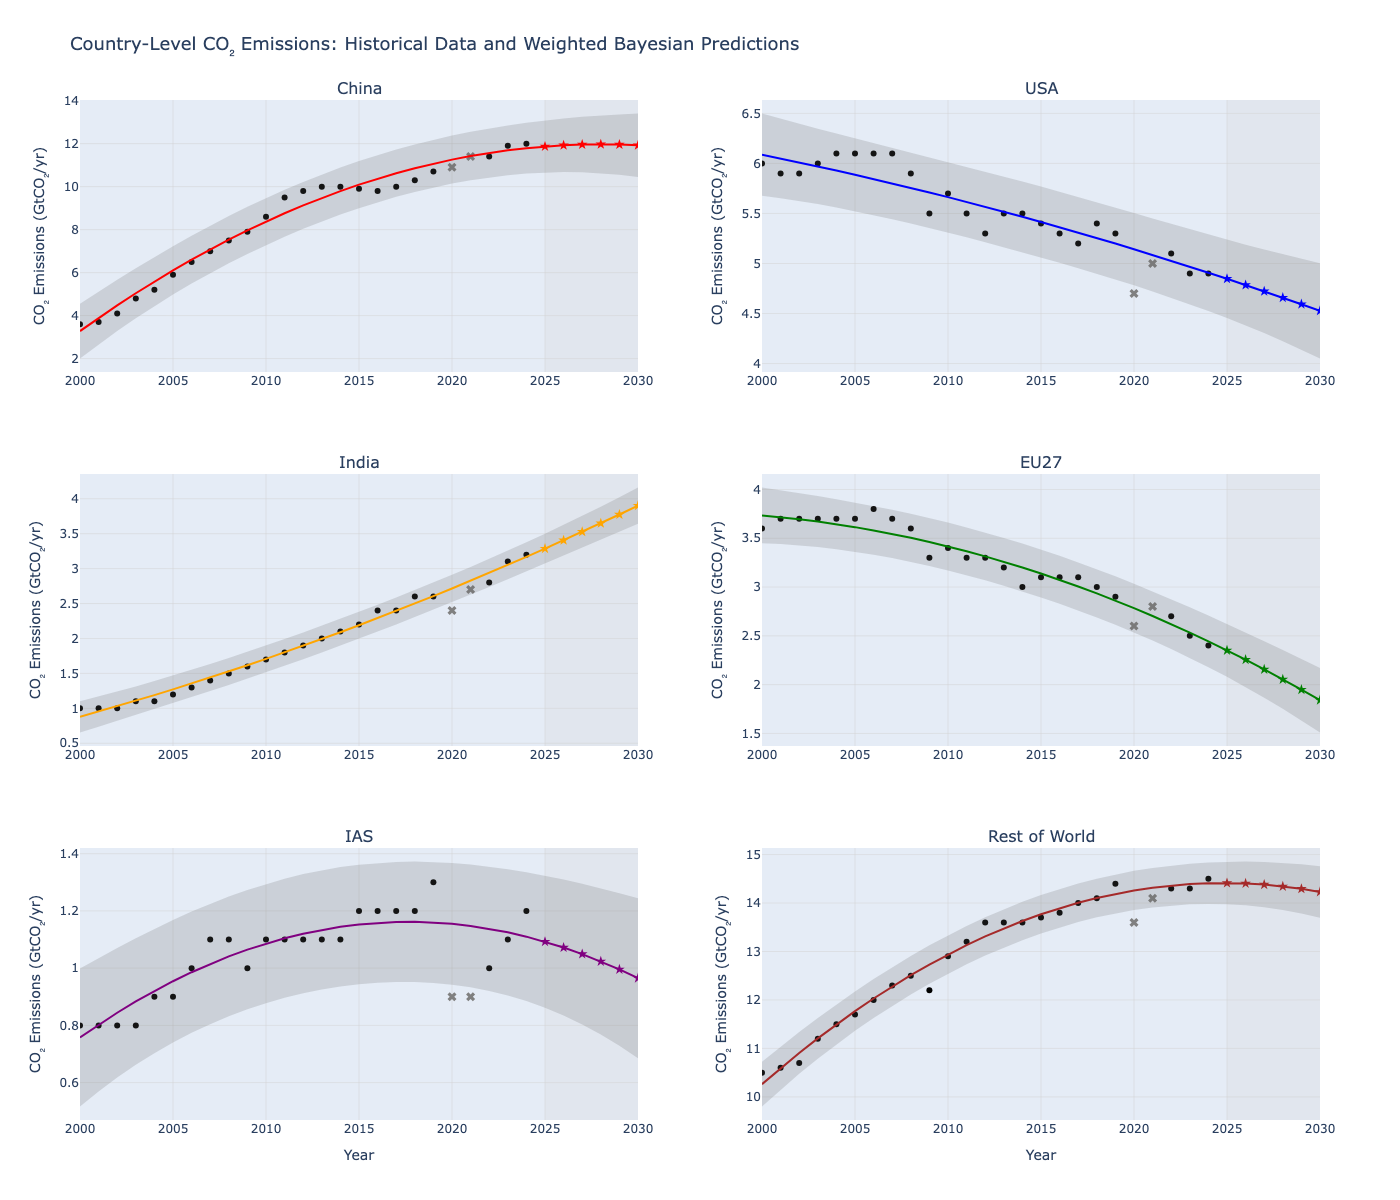
The global peak emerges from a delicate arithmetic balance across major economies. Let me break down what's happening in each region:
China: The Plateau Giant
China's trajectory shows the most dramatic shift. After explosive growth from 2000-2012, emissions growth has moderated significantly. My projections suggest China has essentially plateaued at around 12 GtCO₂/yr. This stabilization is driven by China's structural changes toward lower carbon economic growth, massive renewable energy deployment, and shifting from heavy industry to services.
United States: The Steady Decline
America shows a consistent downward trend from a peak of over 6 GtCO₂/yr in the mid-2000s to under 5 GtCO₂/yr today. My projections show this continuing to approximately 4.6 GtCO₂/yr by 2030. This reflects structural changes in the US economy, the shale gas transition displacing coal, and ongoing efficiency improvements.
European Union: The Climate Leader
The EU demonstrates continuous decarbonization, falling from nearly 4 GtCO₂/yr in the early 2000s to a projected level below 2 GtCO₂/yr by 2030 - nearly a 50% reduction from peak levels. This steep decline proves rapid decarbonization is possible in developed economies through aggressive policy and carbon pricing.
India: The Growth Story
India represents the major upward pressure, with emissions rising steadily from 1 GtCO₂/yr in 2000 to 3.2 GtCO₂/yr in 2024. Unlike China, India shows no signs of plateauing, with projections reaching 4.0 GtCO₂/yr by 2030. This reflects ongoing industrialization and development needs as India's economy continues expanding.
Rest of World: The Largest Stabilizer
Aggregating all other nations shows a plateau around 14.5 GtCO₂/yr with gradual decline by 2030. This represents the most significant contributor to global emissions, and its stabilization has major implications for the carbon peak. This stability masks diverse trends where some nations are growing while others are declining, but they collectively balance out.
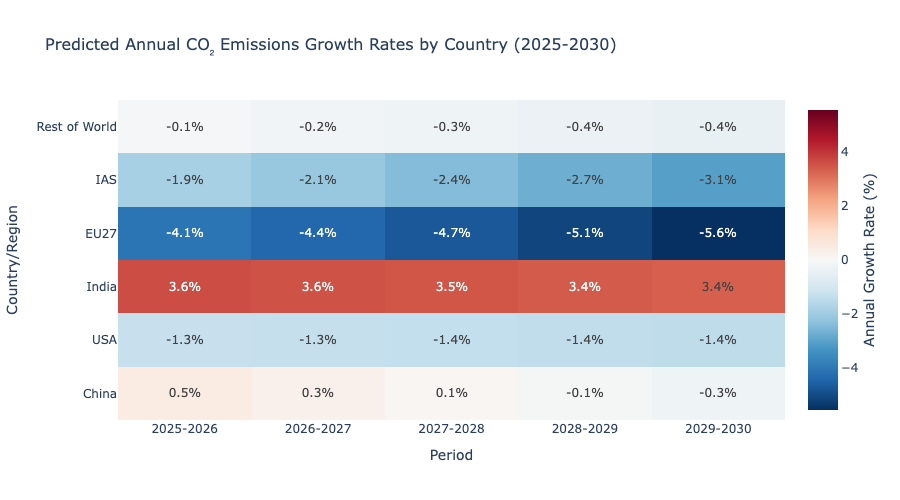
The Mathematics of Peak Emissions
Global carbon emissions have reached a carefully balanced tipping point, with the arithmetic revealing striking precision in how different regions contribute to the overall trend.
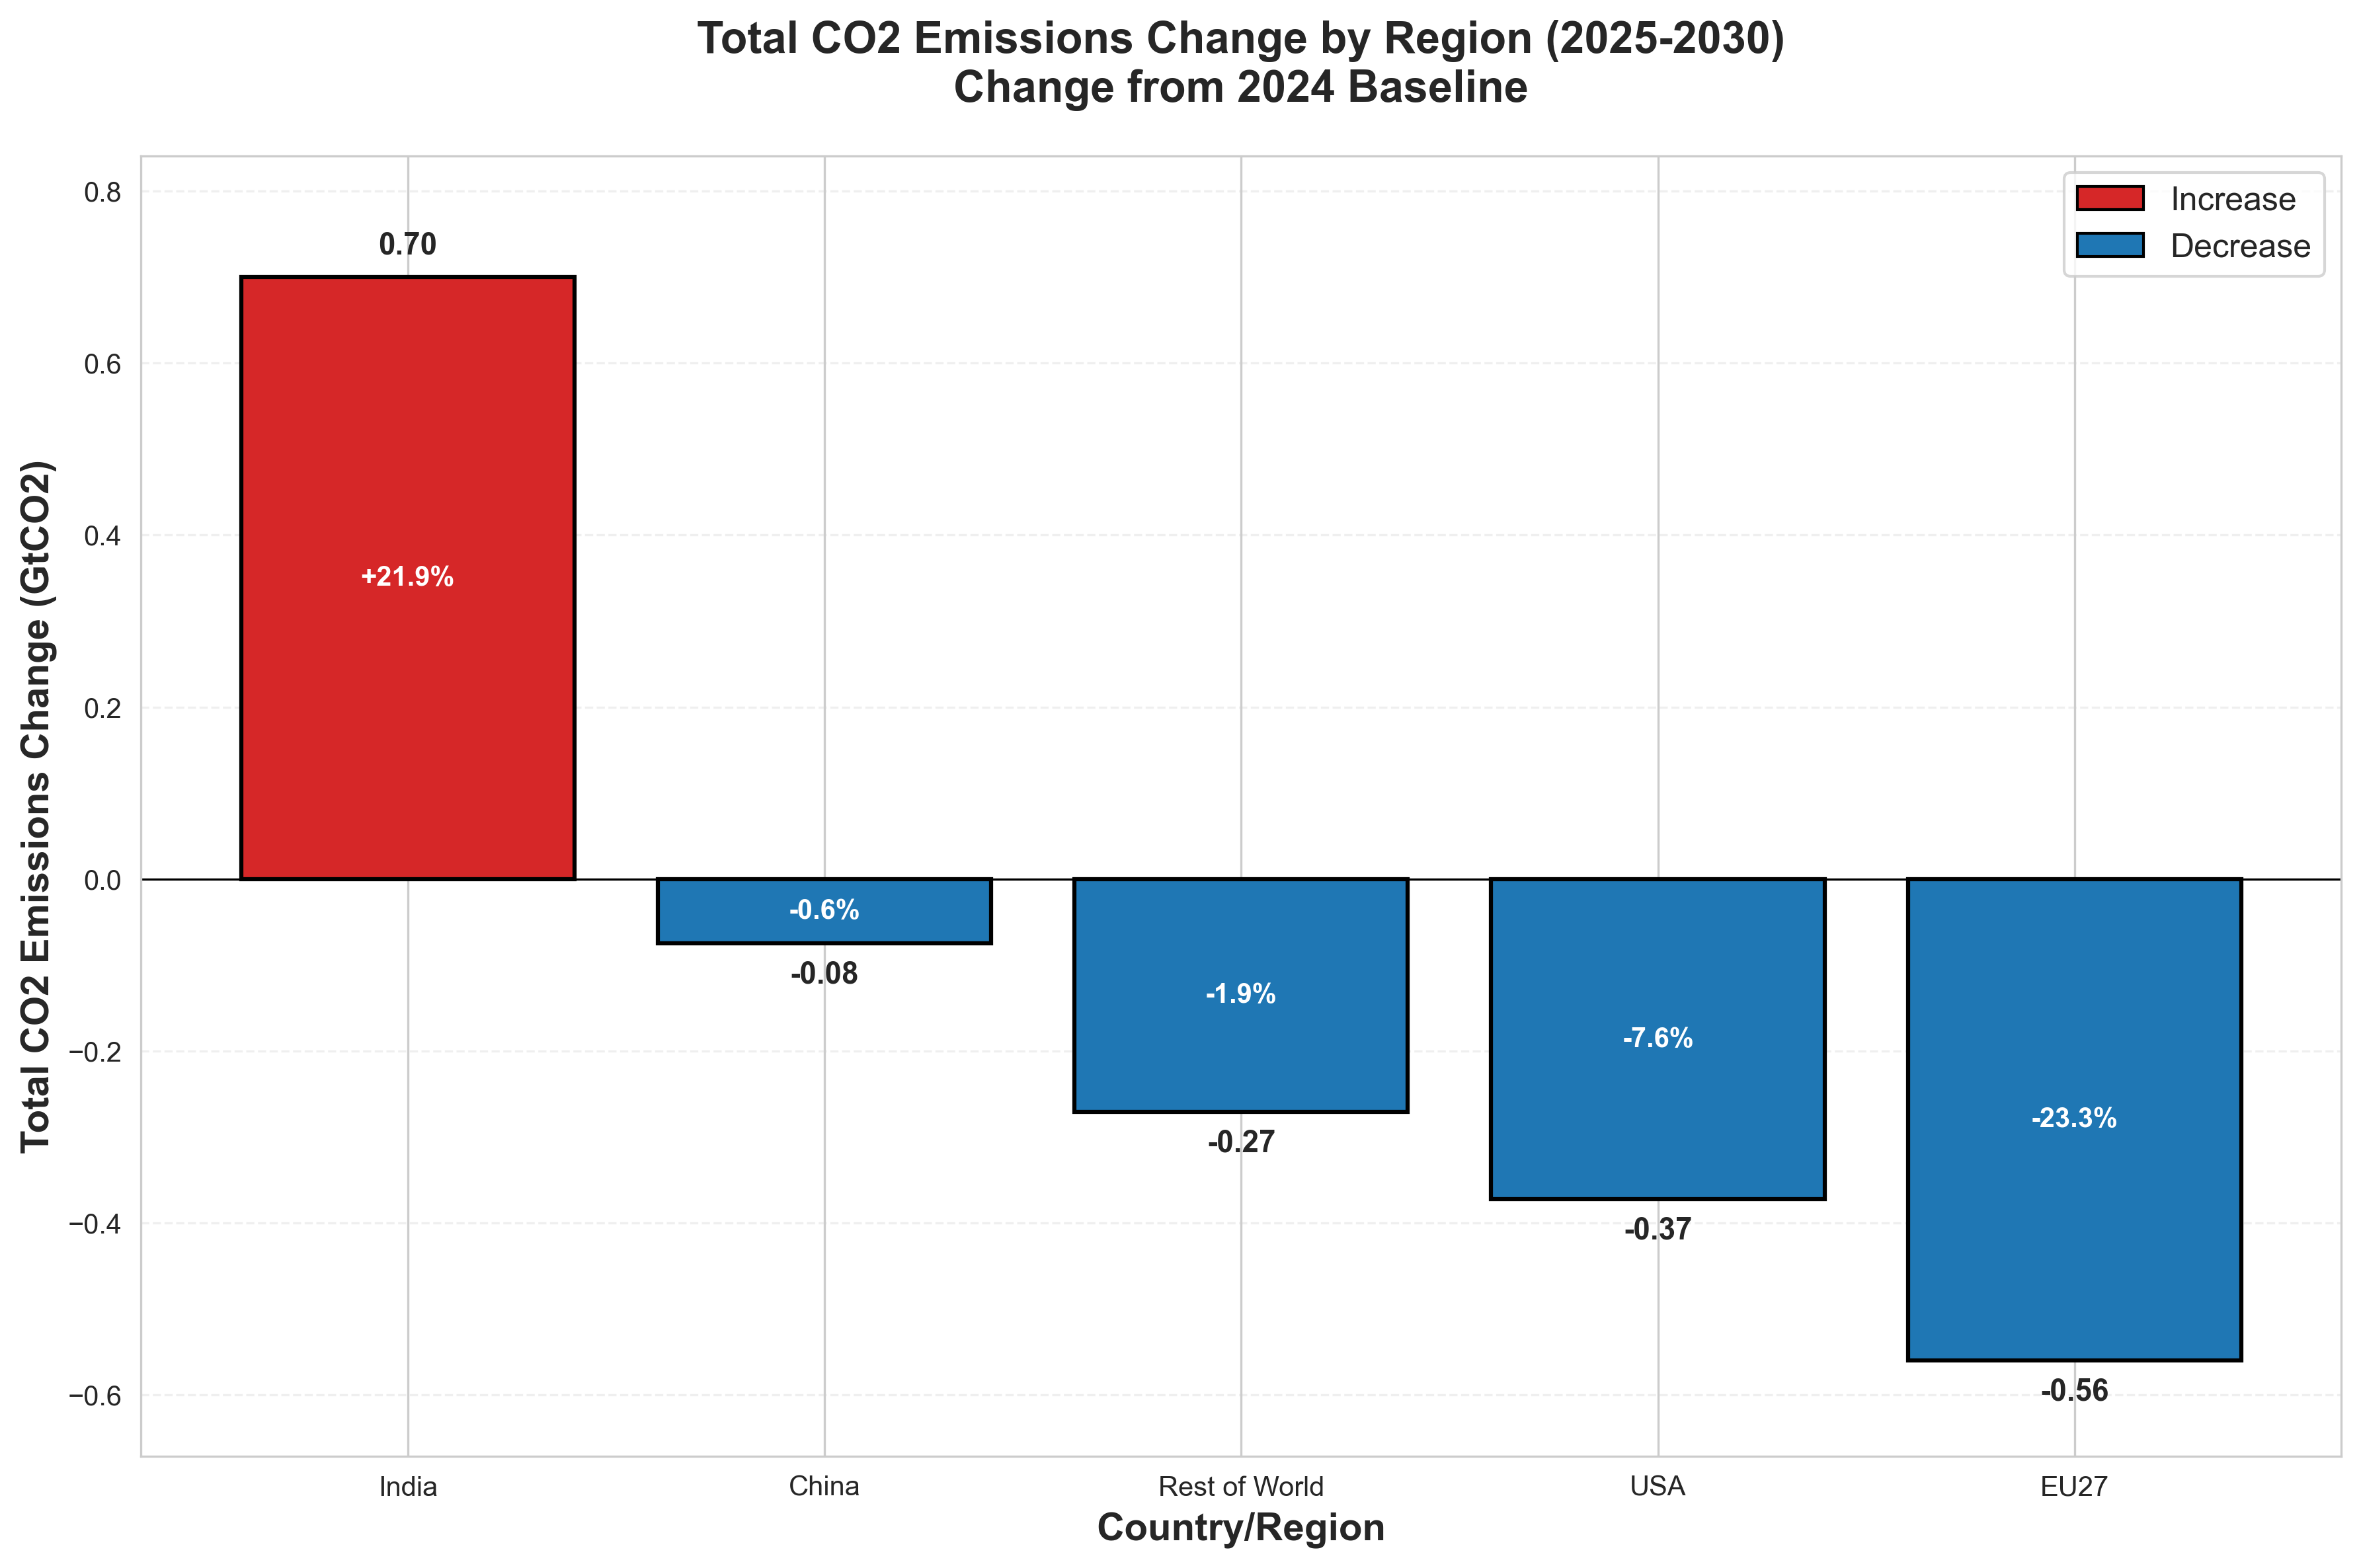
Combined reductions from the United States and EU27 total 0.93 GtCO₂ over the 2025-2030 period, more than offsetting India's growth of 0.70 GtCO₂ over the same period.
The critical factor in achieving net global decline comes from both China and the Rest of World, whose combined emissions are forecast to fall by 0.35 GtCO₂. This additional decrease compounds the net reduction from developed economies, resulting in a total global reduction of 0.58 GtCO₂ over the 2025-2030 period, or approximately 0.12 GtCO₂ annually.
The global emissions peak reflects this delicate balance in action. While India's growth partially offsets developed economies' reductions, the combined declines from the EU, USA, China, and Rest of World ensure the overall downward trend. This marks a historic turning point where global emissions finally begin their descent.
What's Driving the Peak?
Several major structural factors are converging to create this carbon inflection point:
Lower Carbon Energy Transformation: Major economies are shifting from heavy industry to services and adopting cleaner energy sources, reducing carbon intensity per dollar of GDP growth. This transformation is particularly significant in China and the Rest of the World, where rapid deployment of renewables is reshaping energy systems.
High-Carbon Infrastructure Replacement: Old, inefficient fossil fuel infrastructure is being retired faster than it's being replaced, particularly in developed markets.
Technology Cost Curves: Solar and wind are now cheaper than coal in most markets, fundamentally changing investment decisions in new power generation.
Fuel Switching: The transition from coal to natural gas in the US and other economies has significantly reduced emissions intensity in power generation, providing a bridge fuel during the renewable energy transition.
Electric Vehicle Transition: The shift to electric vehicles is driving down global transport carbon intensity given the decarbonising grids, with EV adoption surging particularly in China.
Policy Momentum: Carbon pricing, renewable mandates, and coal plant phase-outs are accelerating across major economies.
Carbon Efficiency Improvements: Buildings and industry are becoming more carbon efficient through better insulation, heat pumps, efficient manufacturing processes, and electrification of heating and industrial operations.
Investment Implications
For investment teams, peak carbon changes the fundamental assumptions underlying climate risk assessment:
Shadow Carbon Pricing: The reversal of emissions reveals a significant shadow price of carbon operating globally—although not formally imposed worldwide, it's being enacted through market mechanisms, national government policies, and corporate operational decisions, creating real economic costs for carbon-intensive activities.
Transition Risk Shifts: Companies positioned for continued fossil fuel demand growth face accelerated stranded asset risks as the growth phase ends.
Regional Divergence: Investment strategies need to account for dramatically different regional trajectories - India's continued growth versus China's plateau versus developed market declines.
Take-Home
Peak carbon emissions aren't just a climate milestone - they represent a fundamental shift in the global economy's relationship with energy and resources.
Based on the forecasts, we are witnessing the most significant inflection point in humanity's carbon trajectory since the Industrial Revolution.
The math is clear: developed economies are cutting emissions faster than developing economies can add them. China's clean energy investments are paying off. The transition has begun, and it's showing up in the global data.
Time to adjust your models, update your assumptions, and position for a world where emission growth is no longer the baseline expectation.
Thanks for reading.
Until next time,
Ben
If you find Ben’s research helpful please click “❤️ Like”. More likes helps this get seen by others. Thanks!
Detailed Forecasting Methodology
Model Architecture
This analysis employs a weighted Bayesian Ridge regression model with polynomial features to capture non-linear trends in emissions data. The Bayesian approach provides several key advantages for emissions forecasting:
Uncertainty Quantification: Full probability distributions for predictions rather than point estimates, allowing us to provide confidence intervals around all projections.
Built-in Regularization: Prior distributions protect against overfitting, particularly important when working with relatively small datasets and polynomial features.
Interpretability: Clear confidence intervals and probability distributions make results accessible for investment decision-making.
Training Data Selection: Why 24 Years?
The choice of 24 years of training data (2000-2024) reflects several insights about carbon emissions behavior:
Structural Transformation Cycles: Carbon emissions are deeply intertwined with infrastructure, technology deployment, and the economy - all of which evolve over decades. The 24-year window captures complete transformation cycles including China's industrialization (2000-2012) and subsequent moderation, the full US shale gas transition, renewable energy evolution from expensive niche to cost-competitive mainstream, and multiple economic cycles including the 2008 financial crisis.
Infrastructure Lock-in Effects: Carbon emissions exhibit strong persistence or ‘stickiness’ due to infrastructure that operates for longer than 20 years. Infrastructure changes slowly, capital stock turnover where vehicle fleets and building stock replace gradually, and carbon intensity relationships that follow long-term trends. These "sticky" relationships mean shorter windows could miss fundamental structural changes.
Avoiding Short-term Bias: Shorter training windows risk overweighting temporary phenomena like economic shocks, weather variations, policy cycles, and lingering post COVID-19 effects. The 24-year window smooths these perturbations while capturing genuine trend changes.
Recency Weighting Scheme
My analysis uses 24 years of emissions data with graduated weighting for recent years: 5x for 2022-2024, 2x for 2010-2019, and 1x for 2000-2009. Multiple weighting schemes were tested, all showing emissions peaking but with different timing. Recency weighting is justified because recent data better reflects current technology costs, policies, and the shift toward service economies. Without it, the model overweights China's 2000-2010 coal boom, skewing projections unrealistically high.
COVID-19 Data Treatment
The 2020-2021 pandemic years are excluded from model training to prevent temporary disruptions from skewing long-term structural projections. These years are marked in visualizations but not used in regression fitting, as the economic shutdown was neither sustainable nor indicative of long-term emission drivers.
Country-Level Disaggregation
The analysis disaggregates global emissions into six major regions/countries using GCP data:
China (largest individual emitter)
United States (second largest, showing consistent decline)
India (fastest growing major emitter)
European Union 27 (climate policy leader)
International Aviation & Shipping (separate sector)
Rest of World (aggregate of all other nations)
Each region is modeled separately using the same Bayesian Ridge methodology, then aggregated to produce global forecasts. This approach captures the distinct emission trajectories and policy environments across major economies.
Model Validation and Key Uncertainties
The model demonstrates excellent fit to historical carbon data with R² values above 0.95 for most country-level regressions. Uncertainty bounds expand appropriately over the forecast period, reflecting increasing uncertainty with longer projection horizons. Cross-validation using rolling windows confirms model stability and predictive accuracy.
The forecasts carry important uncertainties that could affect the timing and magnitude of peak carbon. China's trajectory remains pivotal—while models show plateauing, the country's massive economy could tip in either direction based on policy choices and economic growth patterns. Similarly, the Rest of World represents a diverse group of nations that could shift toward either higher or lower emissions based on development choices and energy access decisions, making these regions critical wildcards in determining whether the global peak carbon scenario holds.
Data Sources and Quality
Emissions Data: All historical CO₂ emissions data sourced from the Global Carbon Budget 2024, published by the Global Carbon Project (Friedlingstein et al., 2025). This represents the world's most authoritative assessment of fossil fuel CO₂ emissions, with comprehensive coverage and rigorous methodology. Analysis includes fossil fuel combustion and industrial processes but excludes land-use change emissions due to higher uncertainty and different drivers.
https://globalcarbonbudget.org/fossil-fuel-co2-emissions-increase-again-in-2024/
https://www.carbonbrief.org/analysis-clean-energy-just-put-chinas-co2-emissions-into-reverse-for-first-time/
How would the emerging economies of Africa look in this analysis? Demography and economic growth suggest these economies could drive a lot of emissions in coming decades.
Really interesting analysis. I wondered if you could expand on what impact you see that carbon pricing - both explicit and implicit - is having diectly on emissions. Is there data to quantify the impact?